
Understanding project management can feel challenging due to the many methods and tools available. One of the most effective tools used in project management is the Gantt chart. Gantt charts have long stood as invaluable tools in project management, providing clear, visual representations of project schedules and allowing team members to understand their tasks and deadlines clearly. In this article, we explore the diverse applications of Gantt charts, highlighting their adaptability and effectiveness in various contexts.
Understanding the Basics of a Gantt Chart
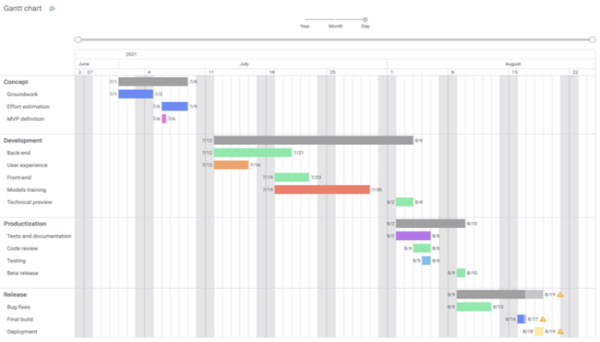
A Gantt Chart, named after Henry L. Gantt, who designed it in the early 20th century, is a type of bar chart that visually illustrates a project schedule. It allows you to see the start and finish dates, the dependencies between tasks, the progress of tasks, and the allocation of resources in a project.
The Gantt chart’s horizontal axis looks at time, while the vertical axis represents tasks. Each task is represented using a bar, with the length indicating the duration of the task. The position of the bar represents the start and end times for each task.
This concept can seem confusing on paper, but when you see a Gantt chart in action, its simplicity and effectiveness become immediately apparent. It’s a practical tool that allows anyone to understand a project’s status at a glance.
Key Elements a Gantt Chart Demonstrates
The primary aim of a Gantt chart is to simplify complex projects by breaking them down into manageable tasks and subtasks, representing these visually in line with their timelines. It then shows dependencies or relationships between tasks and how they overlap.
Milestones are another key element demonstrated in a Gantt Chart. They mark specific points along a project timeline and typically signify the completion of a critical task. They’re often represented by diamond shapes on the chart.
A Gantt chart also has tasks, each with a start date, end date, and duration. The tasks may further be categorized under different phases or workstreams to better understand the different areas of a project.
Lastly, the progress feature allows everyone to see how far along each task and the project as a whole, just by looking at the chart.
The Connection Between Project Management and Gantt Charts

Gantt charts have long been a staple in project management. They provide an easy way to visualize the project timeline, tasks, and progression – aiding with setting realistic timelines and adequately managing resources.
The complexities of project management often lie in its multifaceted nature with tasks, timelines, responsibilities, and unpredictabilities. Gantt charts help managers and teams stay on top of these by giving everyone a clear visual summary of how individual and interconnected tasks are progressing over time.
Moreover, using a Gantt chart can help with resource allocation. By identifying how tasks overlap, when resource shortages might occur, or when resources could be better utilized elsewhere, project managers can maximize efficiency and curb wasted resources.
The tool also mitigates risks by helping identify potential delays or setbacks and showcasing any dependencies or impacts these could have on the project timeline.
Why You Should Use a Gantt Chart for Your Next Project
One of the fundamental reasons for using a Gantt chart in your project management is that it can simplify complex tasks. By breaking a project down into smaller tasks and visually representing these and their timelines, Gantt charts can make comprehending and managing the project easier and more efficient.
Through the visualization of tasks and timelines, Gantt charts also facilitate greater team collaboration. They provide an easy reference for all team members to understand the project’s status, the tasks that need to be performed, and their relationships with other tasks.
Gantt charts are flexible and adaptable. They can cater to projects of any scale or complexity, from straightforward tasks to complex projects involving hundreds of subprocesses and dependencies. This adaptability makes them a valuable tool for different industries and companies of various sizes.
Finally, Gantt Charts help keep projects on track. They allow project managers to spot potential delays or issues before they turn into larger problems, ensuring smoother project management.
Overall, understanding and utilizing Gantt charts is a step towards clearer communication, better planning, and successful project execution. Gantt charts can increase team collaboration and contribute to employee satisfaction. The potential of Gantt charts extends far beyond mere scheduling—they are powerful project management tools that can significantly enhance productivity and success rates.